Android is based on Java. It is well known that the memory management of the Java language is a major feature. It does not need to deal with the entire process of allocating memory to recycling in an object. In Java we just need to simply create new objects. The Java garbage collector will be responsible for reclaiming and releasing the object's memory. If you look at it this way, the garbage collector manages memory and how can a memory leak occur?
In fact, the definition of memory leak in Java is: the object is no longer used by the program, but because these objects are referenced, GC (GarbageCollector) can not recover them.
The following picture can help us better understand the status of the object, as well as the memory leak situation

Unreferenced objects on the left are retrieved by the GC. Objects referenced on the right are not retrieved by the GC. However, unused objects, including unreferenced objects, include a portion of the object that has already been referenced, so memory leaks occur for a long time. Parts that have been referenced but not used.
Then there is a question: Who is not using the object will make the GC can not be recycled?
In mainstream implementations of mainstream programming languages ​​today, it is through Reachability Analysis (ReachabilityAnalysis) to determine whether an object is alive. The basic idea of ​​this algorithm is: starting from a series of objects called "GCRoots" as the starting point, starting from these nodes down the search, the path that the search walks is called the reference chain, when an object does not have any reference chain to GCRoots , indicating that this object is not available and can be recycled.
Objects that can be used as GCRoots include the following:
The object referenced in the virtual machine stack is generally the current local variable in use
· Objects referenced by static properties in the method area are objects corresponding to static variables
· Objects referenced by constants in the method area
The object referenced by the JNI (that is, the general NaTIve method) in the native method stack
When MAT analyzes a memory leak, it also looks at the object's reference chain to GCRoots to locate the leaked code.
Therefore, when an unused object is directly or indirectly referenced by GCRoots, the GC cannot be recycled, resulting in a memory leak.
2, Android memory managementUnderstand the cause of Java's memory leaks, then a general understanding of the memory management mechanism in Android.
Google has an article on Android’s official website that provides an initial introduction to how Android manages application progress and memory allocation: http://developer.android.com/training/arTIcles/memory.html. The Dalvik virtual machine of the Android system plays the role of automatic garbage collection. The Android system does not provide a swap area for the memory. It uses the paging and memory-mapping (mmapping) mechanisms to manage the memory. Here is a brief overview of some important Android systems. The basic concept of memory management.
Allocating and reclaiming memory
Each process's Dalvikheap reflects the use of memory. This is usually the DalvikHeapSize mentioned in the logical sense, it can grow as needed, but the growth behavior will have a system set a ceiling for it.
The logically speaking HeapSize and the actual physical memory size used are not equal, ProporTIonalSetSize (PSS) records the application's own memory and shared with other processes.
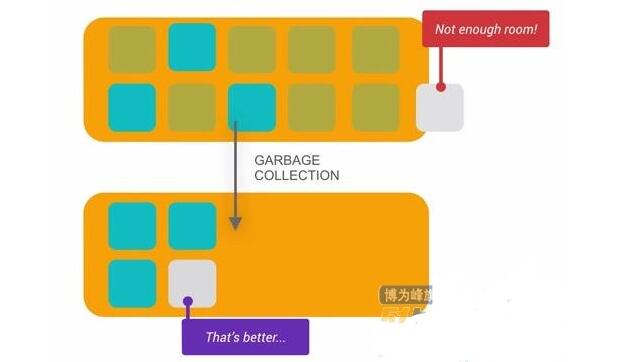
The Android system does not defragment Heap's free memory area. The system will only judge whether the remaining space of the Heap is enough before the new memory is allocated. If there is not enough space, the gc operation will be triggered, thus freeing up more free memory space. In the advanced system version of Android, there is a GeneraTIonalHeapMemory model for Heap space. The newly allocated object is stored in the YoungGeneration area. When the object stays in the area for a certain time, it will be moved to OldGeneration and finally accumulated for a certain time. Move to the Permanent Generation area again. The system will perform different gc operations based on different memory data types in memory. For example, objects that have just been allocated to the Young Generation area are usually easier to destroy and recover, and the gc operation speed in the Young Generation area will be faster than the gc speed operation in the Old Generation area. As shown below:
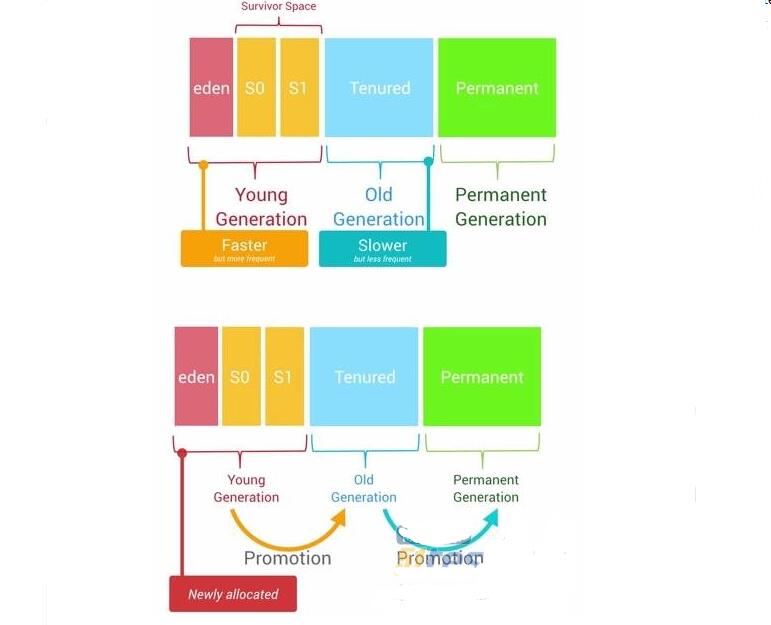
The memory area of ​​each generation has a fixed size. As new objects are allocated to this area one after another, when the total size of these objects reaches the threshold of the memory area of ​​this level, the operation of the GC will be triggered to make room. Out of space to store other new objects. As shown below:
Normally, all threads are suspended when the GC occurs. The time taken to perform the GC is also related to which Generation it occurred in. The time for each GC operation in Young Generation is the shortest, followed by Old Generation, and longest for Permanent Generation. The length of execution time is also related to the number of objects in the current generation. It is naturally much slower to traverse the tree structure to find 20,000 objects than to traverse 50 objects.
Why, under normal circumstances, when the GC occurs, all the threads will be suspended?
Because each GC, you need to first find the GC Roots object, and then search for the reference chain. This process needs to be performed in a consistent memory snapshot. This "consistency" means that there can be no change in the object reference relationship throughout the entire process, so all execution threads need to be suspended.
Limit application memory
In order to control the memory requirements of the entire Android system, the Android system sets a hard Dalvik Heap Size maximum limit threshold for each application. This threshold varies on different devices due to different RAM sizes. If your application's memory usage is close to this threshold, and then try to allocate memory, it is easy to cause OutOfMemoryError error.
ActivityManager.getMemoryClass() can be used to query the currently applied Heap Size threshold. This method returns an integer indicating how many Megabytes your app's Heap Size threshold is.
There is also a method to query with the adb command:
Adb shell getprop dalvik.vm.heapgrowthlimit
3, caseJOOX is a core product of IBG. Since its release in 2014, it has become the top ranked music app in 5 countries and regions. Southeast Asia is the main distribution area of ​​JOOX. In fact, there are still many low-end models in these areas. It is imperative for the memory optimization of the App.
The above describes the Android system memory allocation and recovery mechanism, but also lists the common memory problems, but when we receive a memory optimization task, where should we start? Here is a memory optimization sharing.
1. The first step is to resolve most memory leaks.
Regardless of the current memory footprint of the App, theoretically unnecessary things are best recycled to avoid wasting user memory and reducing OOM. In fact, since JOOX access LeakCanary, each version will do memory leak detection, after several versions of iterations, JOOX has repaired dozens of memory leaks.
2. Use MAT to view memory usage and optimize memory usage.
After JOOX repaired a series of memory leaks, the memory usage remained high and only the MAT was used to see where the memory was occupied. With regard to the use of MAT, there are numerous online tutorials, two MAT tutorials are simply recommended, and MAT-Memory Analyzer Tool is advanced.
Click on Android Studio here to dump the current memory snapshot, because the hprof file directly out of the Android Sutdio dump and the standard hprof file is somewhat different, we need to manually convert, use the sdk directory / platform-tools / hprof-conv.exe can be directly Conversion, Usage: hprof-conv Original .hprof New file .hprof. Only need to input the original file name and the target file name can be converted, after the conversion can be directly opened with the MAT.
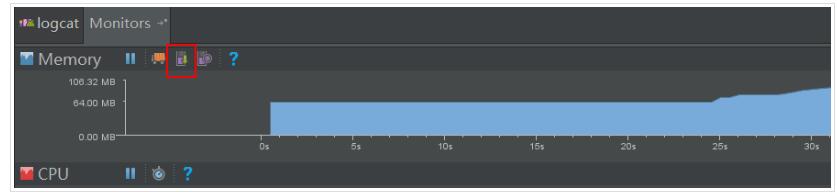
The following is JOOX open App, manual gpro hprof file.
Here we look at the Dominator Tree (ie, the list of objects with the most memory in memory).
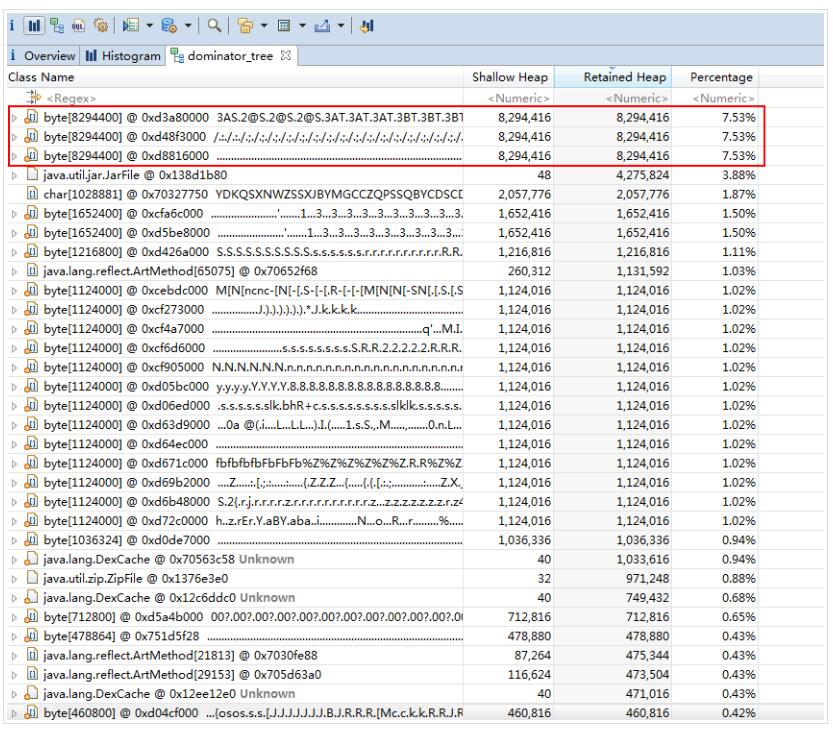
Shallo Heap: The size of the memory occupied by the object itself does not include the memory of the object it references.
Retained Heap: The Retained Heap value is calculated by superimposing the size of all objects in the retained set. Or, because X is released, the size of the heap occupied by all other released objects (including recursively released) is caused.
At first glance there are actually 3 8M objects, which add up to 24M. What is this ghost in the end?
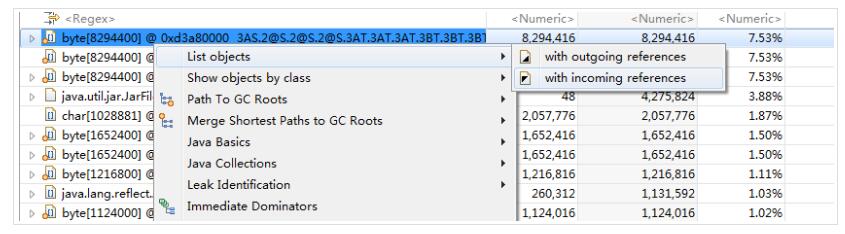
We see through List objects-â€with incoming references (where with incoming references means to see who referenced the object, with outgoing references indicates who this object refers to)
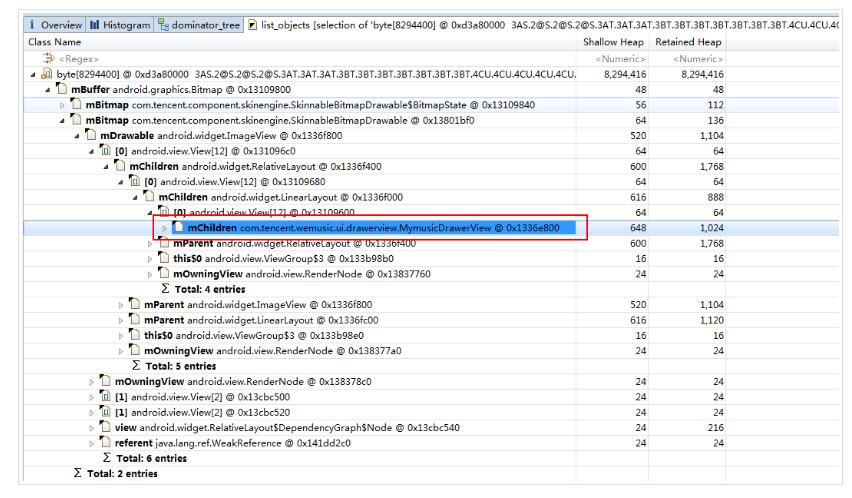
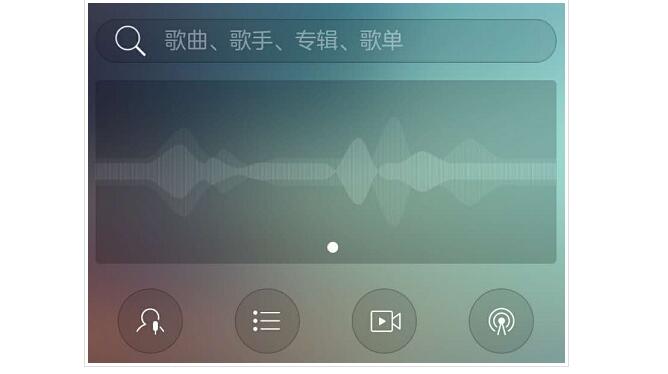
In this way, we see that the three images are the splash screen, the main background of the App, and the background of the App drawer.

There are actually two problems here:
The actual maps of these maps are actually 1280x720, and the actual measurements on the 1080p mobile phone scaled to 1920x1080.
The splash screen, in fact, should be retrievable after the splash screen is displayed. However, due to historical reasons (related to JOOX's exit mechanism), this image is resident in the background, resulting in unnecessary memory usage.
Optimize the way: We move these three pictures from xhdpi to xxhdpi (of course, here need to look at the picture display effect has no great influence), and after the splash screen display recycling flash screen image.
Optimization Results:
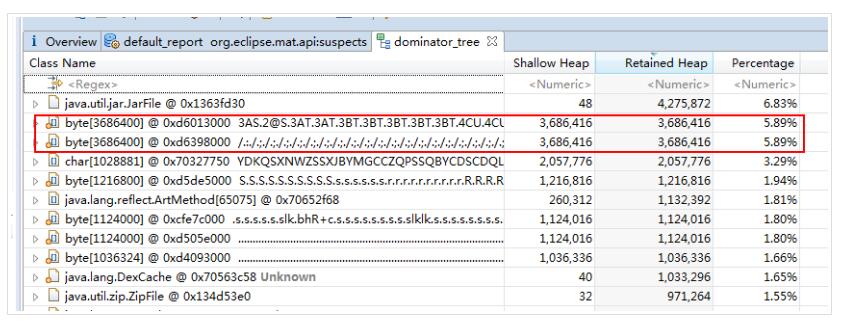
Optimized 17M from the original 8.29x3=24.87M to 3.68x2=7.36M (There is no feeling of a horse galloping. There may be time and effort to optimize a lot of code and optimize for a few hundred K, so in many cases memory optimization When optimizing the picture is relatively immediate).
In the same way, we found that for some of the default maps, the actual requirements of the display requirements are not high (the picture is relatively simple, and in most cases the picture will be loaded successfully), such as the following background banner:
About 1.6M before optimization, about 700K after optimization.
At the same time we also found a default image of a other problem, because of historical reasons, we use the image load library, set the default image interface requires a bitmap, resulting in almost every adapter we used BitmapFactory decode a bitmap, the same The default image is not only reused but also stored in multiple copies. This not only results in wasted memory, but also causes occasional snagging. Here we also use the global bitmap buffer pool for the default image. App globally uses the same bitmap and multiplexes the same copy.
In addition, for the pictures seen from the MAT, sometimes because you can't see the corresponding ID in the project, it will be more difficult to confirm which picture is in the end. Here there is a method on stackoverflow to restore the original data directly through GIM. image.
In fact, here also see JOOX lose a place, JOOX quite a lot of places are using more complex pictures, while some places still need to be fuzzy, animation these are more memory-consuming operations, Material Design came out, many App follow MD The design is revised, usually the default background. The default image is generally a solid color. Not only does the App look bright and light, but it actually saves a lot of memory. In this regard, JOOX has optimized the low-end models.
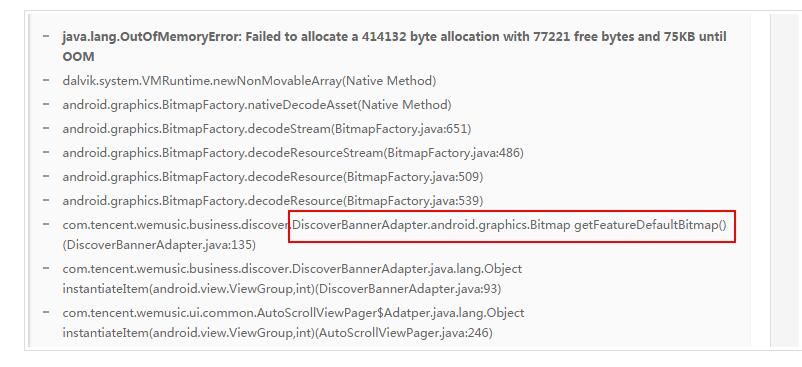
3. We also analyzed OOM on Bugly and found that in fact, some OOM can be avoided.
The following crash is created in the LsitView adapter above to create a bitmap, this place is our home banner, theoretically, App will open this default background image will be cached, and actually used in a period of time Only because of the OOM in order to decode this background image, use global cache instead.
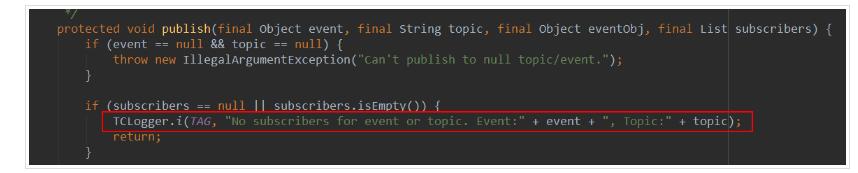
The following is the legendary memory jitter
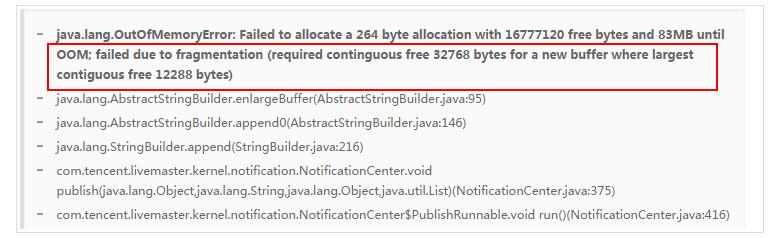
The actual code is as follows. Since the string is concatenated with Log, once the function is called more frequently, memory jitter is likely to occur. Here our new version has been optimized using stringbuilder.
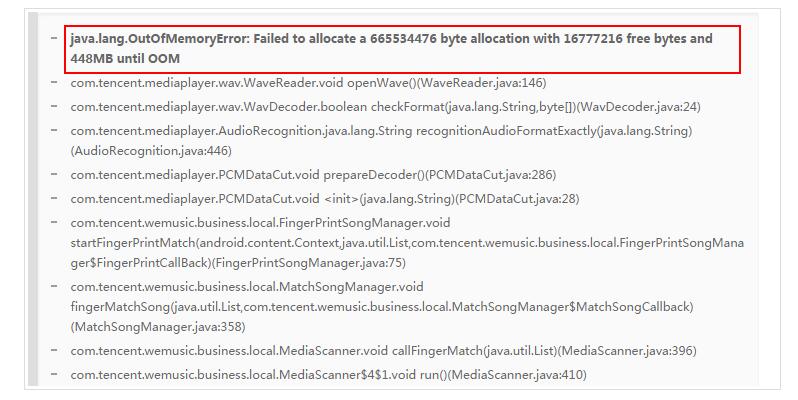
There are some weird situations. This is what happens when we scan the head of a song. Some file headers are actually a few hundred M. This causes one application to have too much memory. The direct OOM is temporarily impossible to fix here. Out of memory error.
4. At the same time, we adjust some of the logic code, such as the third tab (Live tab) of our App homepage for data lazy loading, and timing recovery.

Here because this page in addition to a large map and carousel banner, the actual strong reference picture will have more than one, if this time cut to other pages to listen to songs and other acts, this page has been in the background cache, is actually a waste of memory At the same time, to optimize the experience, we can not directly set the pageview pager cache page number, because this will often be recycled, resulting in affecting the experience, so we clean up the adapter data after a period of time after the page is invisible (just empty the adapter In the data, the data actually loaded from the network is still there. This is just to remove the reference to the image from the interface. When the page is displayed again, the data already loaded is used again, which reduces the reference of the image in many cases, Influence the experience.
5. Finally, we also encountered a rather odd problem. There was a report on our Bugly report.

We saw the relevant discussion on stackoverflow, roughly meaning that in some cases, such as information screens, or in some power-saving modes, frequent adjustments to System.gc() may cause abnormal timeouts due to kernel state switching. This problem does not seem to be a good solution, can only optimize the memory, minimize the manual call System.gc ()
Optimization Results
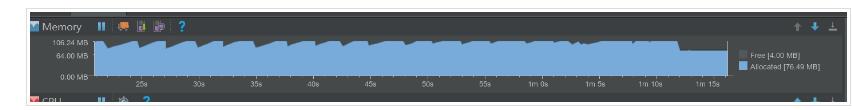
After we start the app, switch to my music interface, stay for 1 minute, after multiple gc, get the App memory usage
Before optimization:
Optimized:
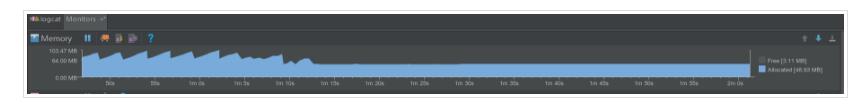
Many test results are similar, only intercepted one of them here, there are 28M optimization results.
Of course, the memory usage of different scenes is different. At the same time, the above test result is the result of multiple manual triggering of gc stabilization. The test results may vary greatly when using other third-party tools without manual gc.
For the above-mentioned problems in the JOOX image background, we have done a dynamic optimization, optimization of different models, for the special low-end models set to a solid color background, the final optimization results are as follows:
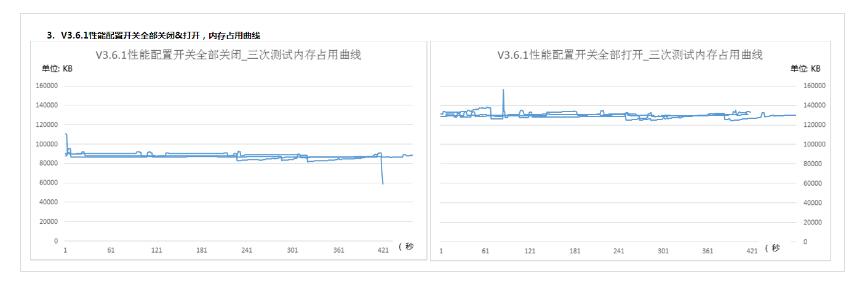
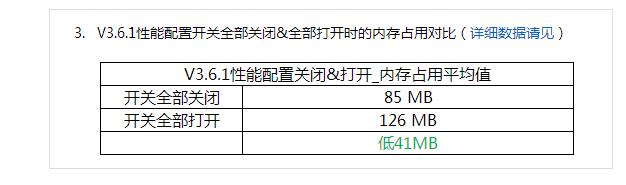
The average memory is reduced by 41M.
This summary is mainly to start with the picture, there is a little logic optimization, has basically reached the optimization goal.
ZGAR bar 2000 Puffs
ZGAR electronic cigarette uses high-tech R&D, food grade disposable pod device and high-quality raw material. All package designs are Original IP. Our designer team is from Hong Kong. We have very high requirements for product quality, flavors taste and packaging design. The E-liquid is imported, materials are food grade, and assembly plant is medical-grade dust-free workshops.
Our products include disposable e-cigarettes, rechargeable e-cigarettes, rechargreable disposable vape pen, and various of flavors of cigarette cartridges. From 600puffs to 5000puffs, ZGAR bar Disposable offer high-tech R&D, E-cigarette improves battery capacity, We offer various of flavors and support customization. And printing designs can be customized. We have our own professional team and competitive quotations for any OEM or ODM works.
We supply OEM rechargeable disposable vape pen,OEM disposable electronic cigarette,ODM disposable vape pen,ODM disposable electronic cigarette,OEM/ODM vape pen e-cigarette,OEM/ODM atomizer device.

ZGAR bar 2000 Puffs Disposable Vape, bar 2000puffs,ZGAR bar 2000 Puffs disposable,ZGAR bar 2000 Puffs,ZGAR bar 2000 Puffs OEM/ODM disposable vape pen atomizer Device E-cig
Zgar International (M) SDN BHD , https://www.oemvape-pen.com